On-Sheet Controls
Interactive Event Type
This sheet includes four types of interactive data collected by Idomoo's player, as configured by you—the author of the video experience.
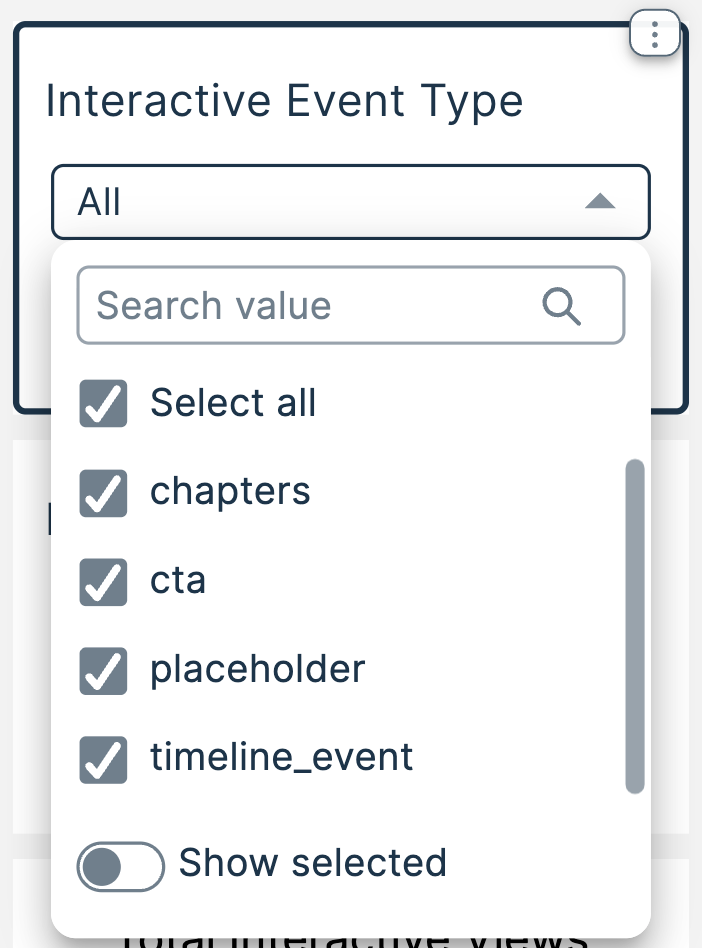
The four event types are:
| Chapters | Clicks on the default navigation menu |
| CTA | Clicks on the landing page |
| Placeholder | Clicks on predefined areas in the video itself |
| Timeline Event | Triggered when a specific point in the video is viewed |
You can filter which types to view using the Interactive Event Type drop-down menu. For example, to view only user-initiated clicks, uncheck Timeline Event.
Interactive Group
You can group interactive events in any way that fits your project. For example, group all navigation-related events under "navigation", or group survey questions together. Set this while configuring player actions in Storybuilder, on the landing page, or via the Scene API using the action name value.
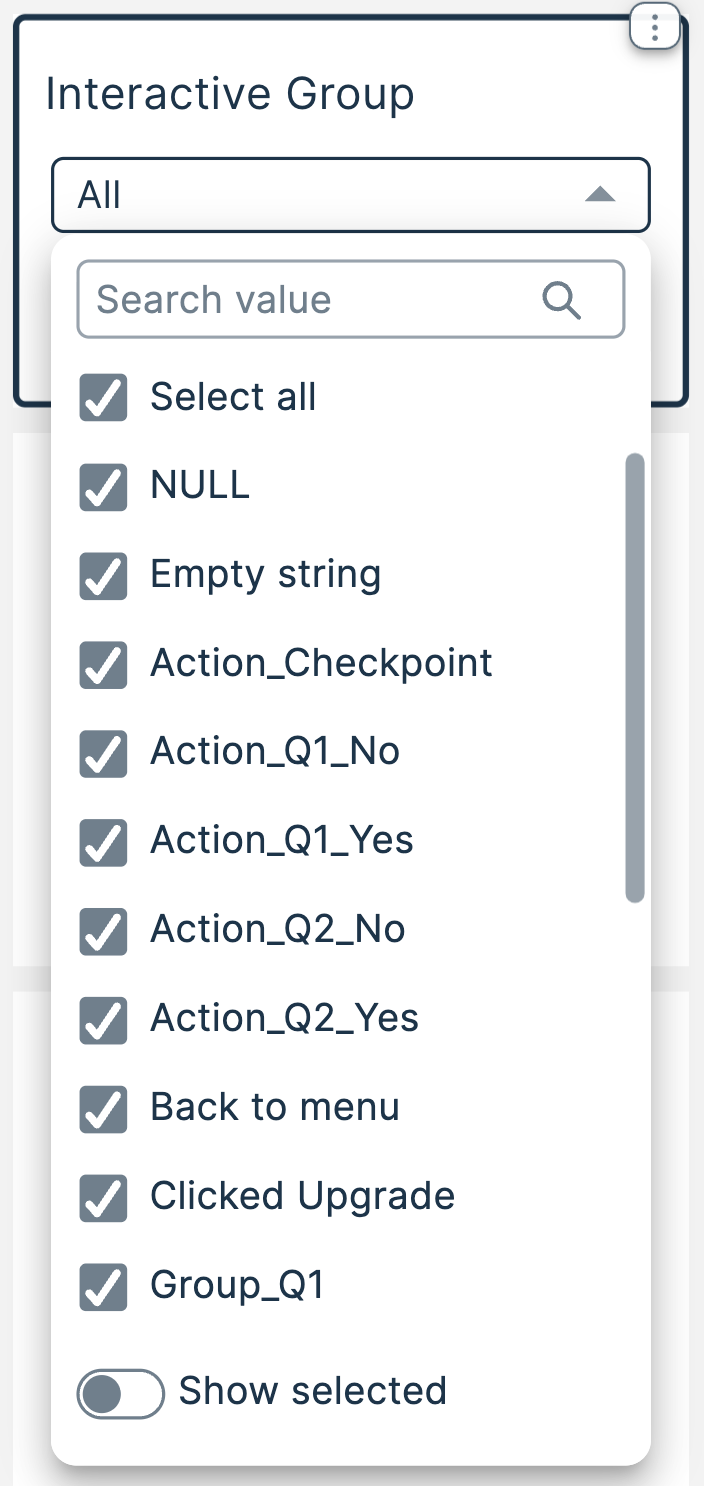
Once your project is set up and data is collected, use the Interactive Group drop-down menu to show or hide specific groups.
Learn more about Interactive Groups in the How to Configure Interactive Player Actions article.
Quick Numbers
To the right of the dashboard, just below the On-Sheet Controls, you’ll find this tab’s Quick Numbers. Let’s go over them.
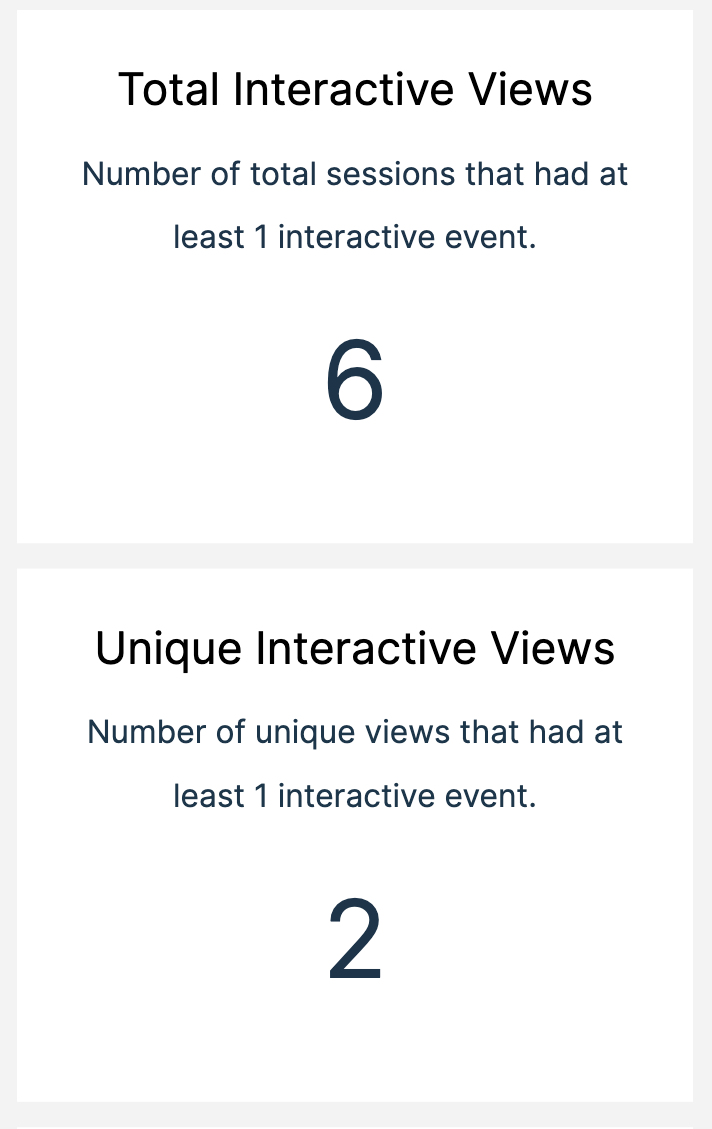
| Total Interactive Views | Total views where at least one interactive event was triggered. |
| Unique Interactive Views | Unique views where at least one interactive event was triggered. |
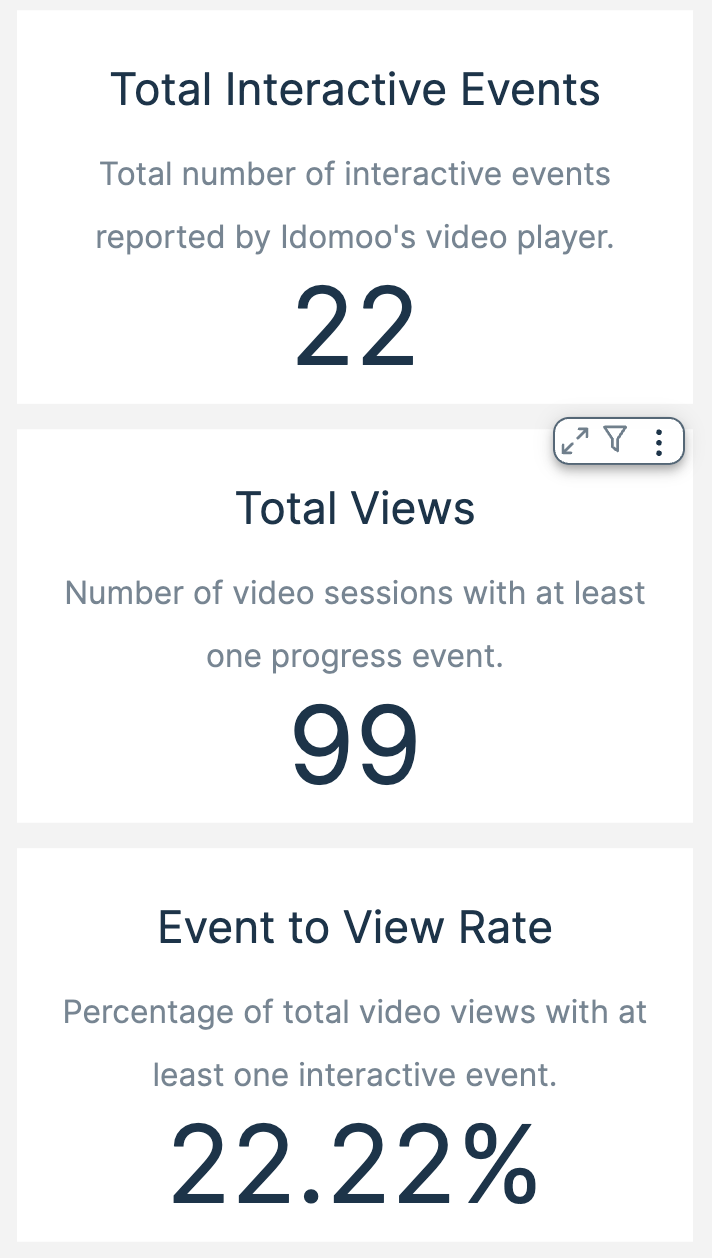
| Total Interactive Events | The total number of interactive events triggered. |
| Total Views | Same as Total Views in the Overview tab. Shown here to give context for the Event to View Rate below. |
| Event to View Rate | The ratio of interactive events to total views, expressed as a percentage. |
Charts and Graphs
Player Interactivity Events Over Time
Displays the number of interactive events, grouped by event name on the Y-axis and plotted by event date on the X-axis.

Player Interactivity Events by Storyboard
Displays the number of interactive events, grouped by event name on the X-axis and organized by Storyboard ID on the Y-axis. Storyboards are sorted in descending order based on the number of events.

Player Interactivity Events
Displays the number of interactive events, grouped by event name and visualized as a pie chart.

Total Checkpoints Triggered
Displays the number of times each checkpoint action was triggered. Action names appear on the Y-axis.
